| Debugging | ||
|---|---|---|
 | Chapter 4. Extended Features |  |
| Debugging | ||
|---|---|---|
| | Chapter 4. Extended Features | |
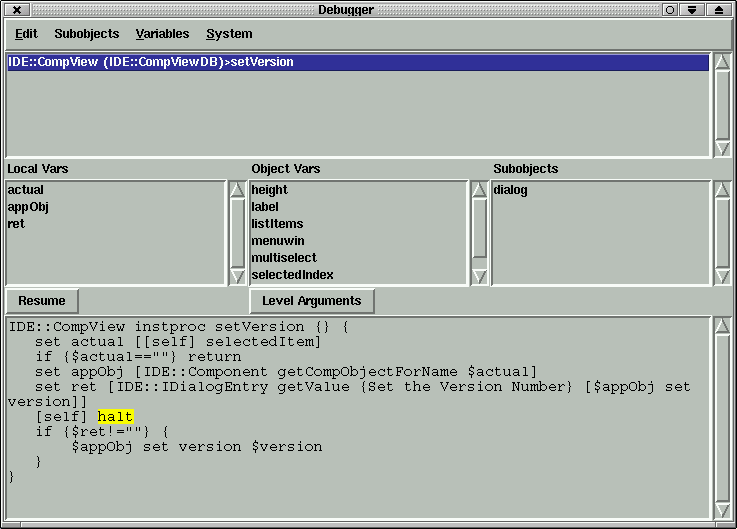
This Browser lets you stop the program flow at a point and view calling stack methods and local variables. To set a break point call the halt method
[self] halt
in Tcl procedures you need to use
Object halt
You can resume the program flow with button or terminate the flow by exiting the browser (close window).
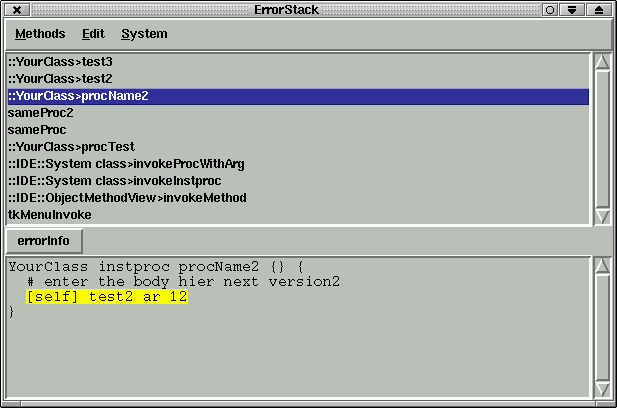
This browser can parse the error stack info “errorInfo”. XOTclIDE modifies the bgerror method and adds a new button to the standard error dialog (XOTclIDE browser). Tcl does not let you inspect the calling stack after errors so this is all the information available after an error. You can view (Button errorInfo) the original errorInfo text. The browser tries to highlight the called methods in the stack. In the extended debugger an error causes the debugger to be invoked directly at the site of the error.
This is a GUI for a browser like the tracker from the XOTcl package xotcl::tracker. You can track calls to every object of a chosen class. To Track a class select menu "Track Class" from the Class Menu in the Component Browser. You can customize the tracker to show
only method entry or exit points
ignore internal calls from the same object
do not show arguments or return values
do not show calling information
XOTclIDE can be used to track read or write access on global variables or object variables. To add some track use variable menu in global variables browser or object inspector. The some selected access occurs the debugger will be invoked in access place. You can inspect in debugger the access context and resume the operation per button resume. The variables can be also watched in entry Tk widget link per -textvariable with chosen variable.
In this screen-shoot are 4 tracked variables. By variable tk_library the debugger are invoked on every read access. There are also one XOTcl variable (object variable) objectVar from object c written in XOTcl style as ::c::objectVar. Local procedures variables can not be tracked or watched.
To add new tracks for chosen variable use Object Inspector or Global Vars Browser. For example -> to add write access track. You can have multiple tracks (read, write, watch) on one variable.
![[Warning]](resources/warning.gif) | Warning |
|---|---|
Watches on variables can prevent proper unset of variables. Therefore watches can influence program flow. | |
| |  | |
| Configurations Management |  | Importing Tcl Projects into XOTclIDE Components |